QA Automation • August 1, 2026
E2E Test Failure Evidence: Screenshots, Video, Traces, and Run History
Learn what evidence every failed E2E browser test should capture, how to read screenshots, video, traces, logs, and run history, and how to turn failures into useful release decisions.
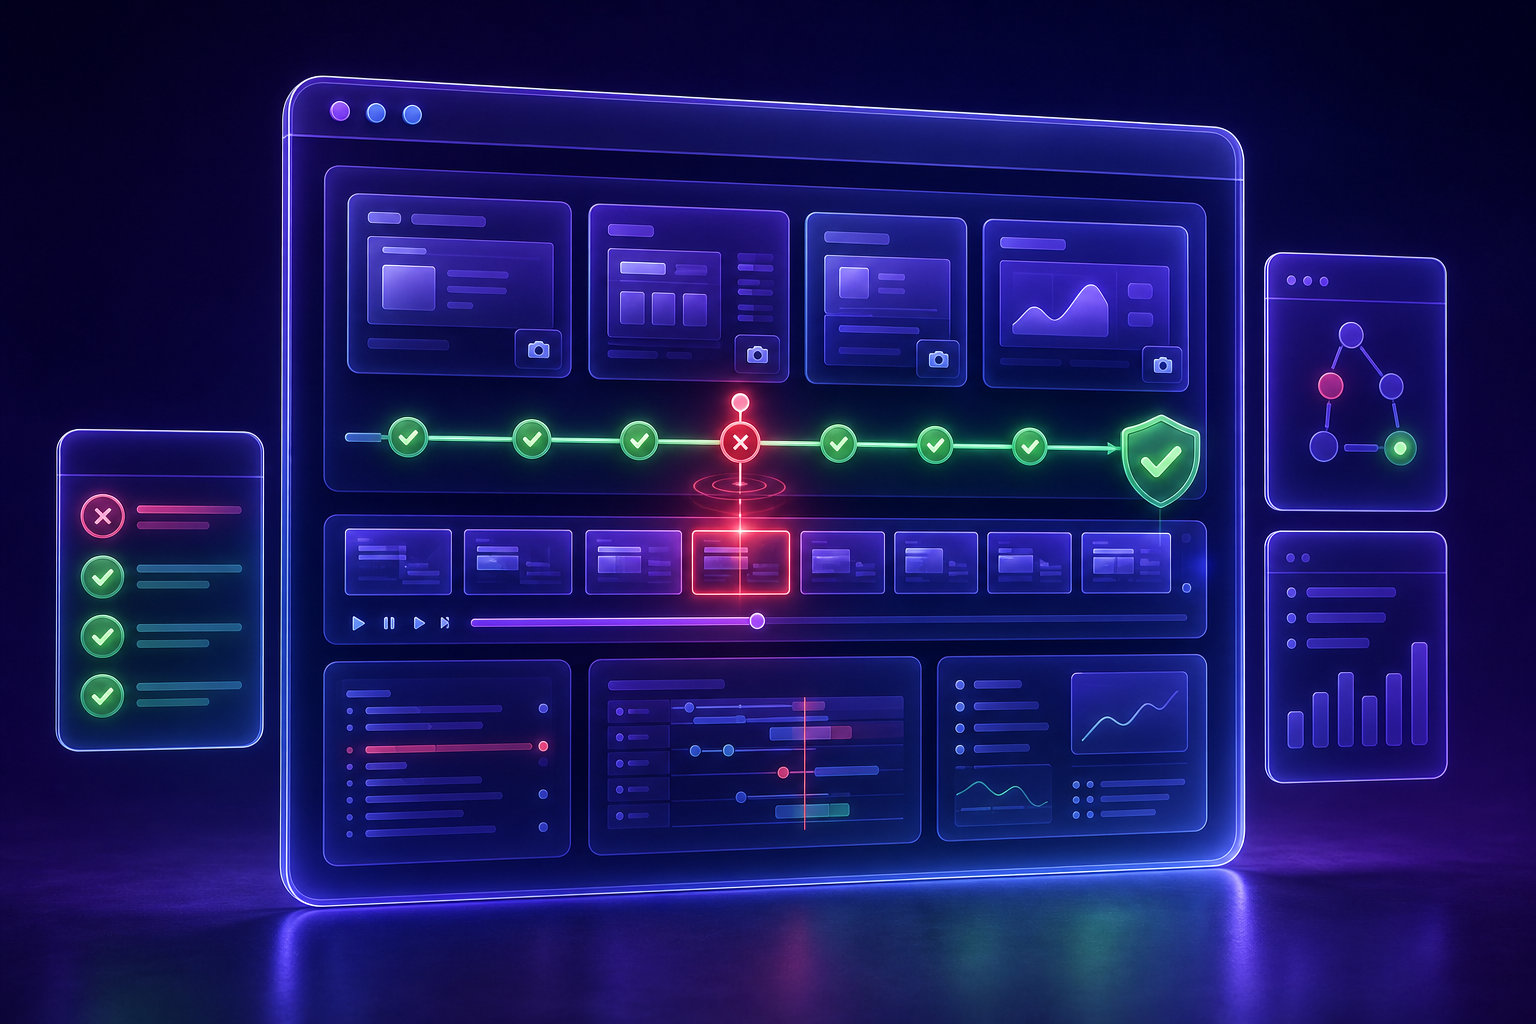
When an end-to-end test fails, the result should answer a practical question: did the product break, did the test break, or did the environment break?
Too many browser suites only return "red." A failed CI job, a screenshot of the last page, or a vague timeout is not enough when the team needs to decide whether to block a release. The useful output is an evidence packet: the failing step, browser state, visible UI, logs, network context, data used, environment, and the last known good comparison.
This is becoming more important as teams add more automated browser checks to pull requests, preview environments, smoke suites, and AI-assisted workflows. Google's 2025 DORA report announcement says AI adoption is now associated with higher throughput, but still has a negative relationship with software delivery stability unless teams have strong controls such as automated testing, mature version control, and fast feedback loops. Failure evidence is one of those feedback-loop controls.
This guide explains what to capture, how to read it, what to avoid, and how no-code E2E teams can make failures actionable without turning every QA run into a developer investigation.
What is E2E test failure evidence?
E2E test failure evidence is the collection of artifacts and metadata that explains what happened during a failed browser test.
For a web application, useful evidence usually includes:
- the test name, run ID, browser, viewport, environment, branch, and commit;
- the failing step and the expected result;
- the screenshot or video frame at the point of failure;
- a step log showing what happened before the failure;
- console errors and relevant network failures;
- the data, credentials, variables, or preconditions used by the run;
- a comparison with the last passing run when available;
- ownership notes: who should review it and what decision it affects.
The goal is not to collect everything. The goal is to make the next action obvious. A failed login test should tell the reviewer whether credentials expired, the login button moved, an API returned 500, a selector stopped matching, or the product genuinely blocked sign-in.
If the team still needs to rerun the test five times, ask a developer to reproduce it locally, and search Slack for context, the evidence packet is incomplete.
Why failure evidence is a timely testing topic
Three current trends make test evidence more valuable in 2026.
First, browser testing tools are moving beyond pass/fail output. The official Playwright best practices recommend using the Trace Viewer for CI failures because it can show the timeline, DOM snapshots, network requests, and more. Playwright also documents video recording for test runs, with options such as retaining video only on failure.
Second, Cypress has made replay-style debugging a major part of its CI workflow. Cypress Test Replay captures commands, network requests, console logs, JavaScript errors, element rendering, DOM mutations, CSS styles, SVG elements, iframes, Shadow DOM, and canvas elements. Cypress positions replay as a way to debug failed and flaky CI runs without relying only on screenshots, videos, and stack traces.
Third, CI systems increasingly treat artifacts as part of the delivery process. GitHub Actions documentation describes workflow artifacts as a way to persist and share build and test output after a job completes, including test results, failures, and screenshots. That makes evidence easier to attach to a release gate, pull request, or incident review.
The trend is not "collect more files." The trend is "make a failed browser check reviewable."
Screenshots, video, traces, and logs: what each one is good for
Each evidence type answers a different question. Use them together instead of expecting one artifact to explain every failure.
| Evidence | Best question it answers | Common blind spot |
|---|---|---|
| Screenshot | What did the page look like when the run stopped? | It may miss the action that caused the failure. |
| Video | What sequence led to the failure? | It can be hard to inspect DOM, network, or console details. |
| Trace or replay | What happened at each browser action, DOM state, and network moment? | It can capture sensitive data if access and retention are not controlled. |
| Step log | Which test step failed and what did the runner expect? | It may not show what the user actually saw. |
| Console and network logs | Did client code or an API fail? | Logs can be noisy without a failing-step boundary. |
| Run history | Is this new, repeated, intermittent, environment-specific, or data-specific? | History is only useful when tests and environments are named consistently. |
A screenshot is usually the fastest clue. A video explains sequence. A trace or replay gives developer-grade debugging context. Logs separate UI failures from backend or integration failures. Run history tells the team whether to treat the failure as a fresh regression, a known flaky test, or a broken environment.
The minimum useful failure packet
For most QA and product teams, the minimum evidence packet should be small enough to review in a minute.
It should answer seven questions:
- What test failed?
- Where did it run?
- What step failed?
- What did the test expect?
- What did the browser show?
- What changed since the last passing run?
- Who owns the next decision?
Here is a practical template:
| Field | Example |
|---|---|
| Test | Checkout smoke test |
| Environment | Pull request preview, Chrome, desktop viewport |
| Failed step | Click "Place order" and expect confirmation page |
| Visible evidence | Screenshot or video frame shows payment error banner |
| Technical evidence | Network log shows payment sandbox returned 422 |
| History | Passed on the previous preview; failed on this branch twice |
| Owner | Developer reviews payment payload; QA keeps test unchanged until root cause is known |
This format keeps the conversation grounded. The first question is not "should we rerun?" It is "which evidence points to the next responsible owner?"
How to classify a failed E2E run
Most browser test failures fall into one of five buckets.
1. Product regression
The application changed in a way that breaks a user outcome. The page returns an error, the success message never appears, the redirect goes to the wrong place, or a required control is missing.
Evidence pattern: screenshot or video shows the wrong UI state, assertions fail for a user-visible outcome, and logs may show an application error.
Decision: block the release or pull request when the path is release-critical.
2. Test maintenance issue
The product still works, but the test no longer describes the product correctly. A button label changed, a selector became brittle, or the test expects an old page order.
Evidence pattern: the video shows a reasonable product change, the failing step targets an outdated element, and manual review confirms the user can still complete the flow.
Decision: update the affected step, assertion, selector, or precondition. Do not hide it with retries.
3. Data or credential problem
The flow is valid, but the test data is not. A password expired, an invite link was reused, a product is out of stock, or a shared account has a changed role.
Evidence pattern: the failure repeats on the same account or data record, and the UI shows an authentication, permission, quota, or validation problem.
Decision: fix the data contract. The E2Easy guide to test data management for E2E testing covers patterns for credentials, generated data, cleanup, and environment variables.
4. Environment failure
The application might be fine, but the target environment is unhealthy. The preview URL is down, a backend dependency is unavailable, or the browser runner cannot reach the app.
Evidence pattern: network errors, 5xx responses, DNS errors, failed page loads, or broad failures across unrelated tests.
Decision: route to the environment owner and avoid editing healthy tests.
5. Flaky timing or runner instability
The test sometimes passes and sometimes fails on the same code. Common causes include async rendering, animation timing, shared data, resource limits, and third-party scripts.
Evidence pattern: run history shows intermittent failures, and artifacts differ between attempts without a matching product change.
Decision: treat the test as repair work, not random noise. The E2Easy guide on how to fix flaky tests explains a focused stabilization playbook.
A review workflow for failed browser tests
Use the same review order every time. Consistency prevents teams from jumping to a fix before they know what failed.
1. Start with the failed step
Read the failing step and expected result before opening screenshots or logs. This anchors the investigation in the user outcome the test was supposed to prove.
Bad failure: "Timeout after 30000 ms."
Useful failure: "Step 8 failed: expected the confirmation heading to be visible after submitting checkout."
2. Compare visible evidence with the expected outcome
Open the screenshot or video and ask whether the user reached the intended state. If the page is visibly broken, the product may be at fault. If the page is fine but the test clicked the wrong element, the test may need maintenance.
3. Check run history before editing
Do not patch the test from one failure in isolation. Review whether the same test passed on the last release, failed only on a preview URL, failed only in one browser, or failed across multiple unrelated flows.
Run history turns a screenshot into a pattern.
4. Look at console and network evidence
Network and console data can separate a UI change from an application error. A missing button and a 500 response are different problems. A failed assertion and a blocked API call need different owners.
5. Decide whether the release is blocked
Every failure does not need the same response. A failed checkout smoke test on a production release candidate may block deployment. A low-priority visual mismatch in a draft preview may create a follow-up task.
The important part is that the evidence supports the decision. If your team is building release gates, the E2Easy guide to automated smoke testing for web apps explains how to keep those gates focused.
6. Preserve the evidence before changing the test
If a test needs maintenance, keep the failed-run evidence linked to the update. That helps reviewers understand whether the change fixed a brittle test or changed the quality bar.
For pull request previews, the E2Easy guide to preview environment E2E testing covers how to attach browser checks to the review moment.
How E2Easy fits failure evidence
E2Easy is useful when the people who understand the user flow do not want to maintain a full Playwright or Cypress codebase just to get repeatable browser evidence.
Repository content verifies these E2Easy capabilities:
- record, edit, and replay browser tests without writing scripts;
- create tests through the Chrome extension or Claude Connector;
- manage saved tests, folders, variables, credentials, and preconditions in the workspace;
- run tests from the extension, workspace, or server runners depending on the plan;
- review run history with status, duration, metadata, failing steps, screenshots, video, and accessibility markers when available;
- use E2Easy MCP to let an approved AI agent create, run, schedule, and inspect browser tests from the same workspace.
That makes E2Easy a practical layer for QA teams that need evidence, not only automation. A teammate can record the critical flow, add assertions, run it before release, and inspect the failed run without first building a custom reporting stack.
Use the E2Easy documentation for recording, assertions, variables, credentials, playback, server runners, and troubleshooting. If your team works through AI agents, the E2Easy MCP guide explains how agents can run tests remotely and review available run-history details.
What not to capture
Failure evidence can create risk if teams collect sensitive data without rules.
Avoid capturing:
- real customer credentials;
- payment card details outside approved sandbox flows;
- personal data that is not needed for the test;
- private messages, files, or account pages unrelated to the scenario;
- secrets embedded directly in step text, screenshots, logs, or videos.
Prefer test accounts, synthetic records, sandbox integrations, masked secrets, and environment-scoped variables. Decide retention and access before you turn on richer artifacts such as video, traces, or replay.
Evidence should make debugging easier without creating a second data-governance problem.
A two-week rollout plan
Week 1: standardize one failed-run review
Pick one existing E2E flow that already matters to a release decision. Add or confirm assertions at the important outcome. Run it in the environment where failures matter, then document what the failed-run packet must include.
Your checklist should include:
- test name and owner;
- environment and browser;
- failed step and expected outcome;
- screenshot or video evidence;
- relevant logs or run notes;
- data or credential dependencies;
- release decision rule.
Do not expand coverage yet. First make one failure easy to review.
Week 2: connect evidence to ownership
Add two or three more critical flows. For each one, define who reviews product regressions, test maintenance issues, data failures, and environment failures.
Then add a lightweight review rule:
- Product regression: block the release path.
- Test maintenance: update the affected step and rerun.
- Data problem: fix the data contract before changing test logic.
- Environment failure: route to the environment owner.
- Flake: stabilize or quarantine with an owner and deadline.
The goal is not a perfect dashboard. The goal is a repeatable decision.
FAQ
Are screenshots enough for E2E failure debugging?
Sometimes, but not usually. A screenshot shows the final state. It may not show the action, network response, console error, or data condition that caused the failure. Pair screenshots with step logs, run history, and video or traces when the decision is important.
Should every E2E test record video?
Not necessarily. Video is useful for failed or high-risk flows, but it can increase storage and review overhead. Many teams keep richer artifacts only for failures, retries, release gates, or tests that are hard to reproduce.
What is the difference between a trace and a video?
A video shows the visual sequence. A trace or replay can expose structured debugging context such as steps, DOM snapshots, network requests, console logs, and timing. Developers often need trace-style evidence when the visible page does not explain the failure.
How long should failed-run evidence be kept?
Long enough to review the release decision, compare against recent passing runs, and investigate recurring failures. Retention should be shorter for sensitive environments and longer for release-critical flows where history helps find patterns.
Can no-code E2E tools provide useful failure evidence?
Yes, if they store clear run history, failing steps, screenshots or video, status, duration, and enough metadata to identify the environment and data used. The value is not that the test is no-code. The value is that the failed run leaves evidence a team can act on.
Make every red run explain itself
A failed E2E test should not start with guessing. It should start with evidence: what failed, where it failed, what the browser showed, what the logs say, and who owns the next decision.
That discipline is what turns browser automation from a noisy red/green signal into a release control people trust.
Author: E2Easy Team | Date: August 1, 2026